
El GOLD se aproxima a la resistencia de un Cuña descendente
El GOLD se está acercando a la línea de resistencia de un Cuña descendente. Ha llegado a esta línea en numerosas ocasiones durante los últimos 8 días. Si vuelve a probarla de nuevo, debería hacerlo en las próximas 2 días.
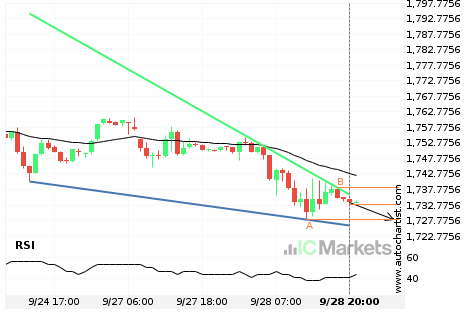
GOLD – acercándose a el soporte del Cuña descendente
El GOLD avanza hacia la línea de soporte de un Cuña descendente. Como le hemos visto retroceder desde esta línea ya antes, podríamos presenciar, o bien, una irrupción a través de esta línea o una recuperación a los niveles actuales. Ha llegado a esta línea en numerosas ocasiones en los últimos 5 días y puede […]
El SILVER se aproxima a el soporte de un Triángulo descendiente
El SILVER se está acercando a la línea de soporte de un Triángulo descendiente. Ha llegado a esta línea en numerosas ocasiones durante los últimos 9 días. Si vuelve a probarla de nuevo, debería hacerlo en las próximas 2 días.

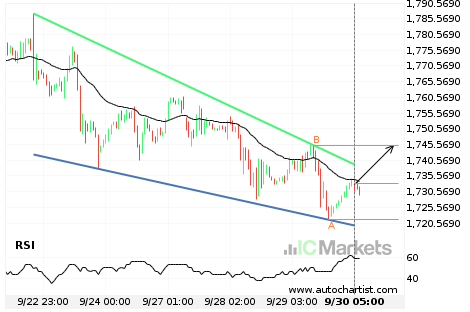
El GOLD se aproxima a el soporte de un Cuña descendente
El GOLD se está acercando a la línea de soporte de un Cuña descendente. Ha llegado a esta línea en numerosas ocasiones durante los últimos 8 días. Si vuelve a probarla de nuevo, debería hacerlo en las próximas 2 días.

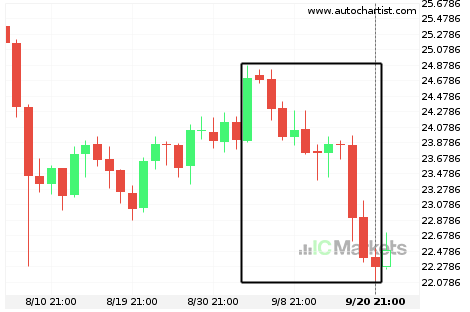
Extraordinario movimiento bajista del SILVER
El SILVER ha descendido un 9,25% de 23,895 a 22,425 en 23 días.
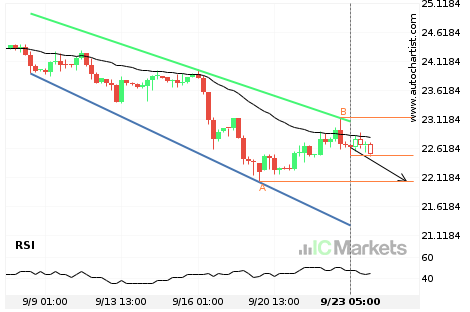
SILVER – acercándose a el soporte del Canal bajista
El SILVER avanza hacia la línea de soporte de un Canal bajista. Como le hemos visto retroceder desde esta línea ya antes, podríamos presenciar, o bien, una irrupción a través de esta línea o una recuperación a los niveles actuales. Ha llegado a esta línea en numerosas ocasiones en los últimos 15 días y puede […]

El GOLD se aproxima a la resistencia de un Triángulo
El GOLD se está acercando a la línea de resistencia de un Triángulo. Ha llegado a esta línea en numerosas ocasiones durante los últimos 8 días. Si vuelve a probarla de nuevo, debería hacerlo en las próximas 2 días.
¿Hacia dónde se dirige el SILVER?
Un movimiento de un 9,91% en 19 días de SILVER no pasa desapercibido. Puede empezar a considerar hacía donde se dirigirá ahora: si seguirá con la tendencia descendente actual o volverá a la dirección anterior.
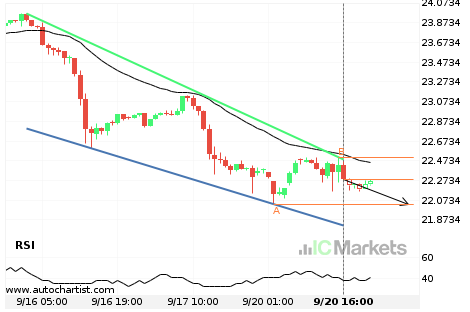
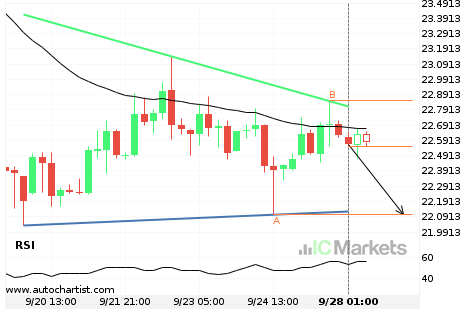
Inminente recuperación o irrupción del SILVER
El SILVER se dirige a la línea de soporte de un Cuña descendente. Si este movimiento se mantiene, esperamos que el precio de SILVER pruebe el nivel de 22.0350 en las próximas 14 horas. Pero no se apresure en sus operaciones, porque ya ha probado esta línea en numerosas ocasiones, por lo que este movimiento […]

Inminente recuperación o irrupción del SILVER
El SILVER se dirige a la línea de soporte de un Canal bajista. Si este movimiento se mantiene, esperamos que el precio de SILVER pruebe el nivel de 22.1320 en las próximas 11 horas. Pero no se apresure en sus operaciones, porque ya ha probado esta línea en numerosas ocasiones, por lo que este movimiento […]